
NCERT Solutions for Class 7 Science Chapter 13 Motion and Time

NCERT Solutions for Class 7 Science Chapter 13
NCERT Solutions for Class 7 Science Chapter 13: This page consists of details solution of chapter Motion and Time class 7 science. You can check NCERT Solutions for class 7 Science for other chapters of class 7 science prepared by Physics Wallah. do the questions by yourself and check your solution with Physics Wallah NCERT solution for the chapter Motion and Time. to have more depth in chapter Motion and Time class 7 science you must read the theory of Motion and Time and do the additional question of Physics Wallah click this link to do the questions and read theory of Motion and Time. along with NCERT solution of class 7 science.
NCERT Solutions for Class 7 Science Chapter 13 Motion and Time Overview
NCERT Solutions Class 7 Science Chapter 13 covers these important topics. Students are advised to thoroughly review each topic in order to completely understand the ideas covered in the chapter and make good use of the offered solutions. These solutions are a result of the teachers at Physics Wallah working hard to improve students' understanding of the concepts covered in the chapter. After going over and rehearsing these answers, the goal is for students to easily score high exam resultsNCERT Solutions for Class 7 Science Chapter 13 Motion and Time
| CBSE Syllabus Class 7 | |
| CBSE Class 7 English Syllabus | CBSE Class 7 Math Syllabus |
| CBSE Class 7 Social Science Syllabus | CBSE Class 7 Science Syllabus |
NCERT Solutions for Class 7 Science Chapter 13 Eexercise 1
Question 1: Classify the following as motion along a straight line, circular or oscillatory motion:
(i) Motion of your hands while running.
(ii) Motion of a horse pulling a cart on a straight road.
(iii) Motion of a child in a merry-go-round.
(iv) Motion of a child on a see-saw.
(v) Motion of the hammer of an electric bell.
(vi) Motion of a train on a straight bridge.
Answer: (i) Oscillatory motion
While running, the hands move to and fro and repeat their motion after a given interval of time. Hence, it is an oscillatory motion. (ii) Straight line The horse is pulling a cart on a straight road. Therefore, it has a motion along a straight line. (iii) Circular motion Merry-go-round has a circular motion. Therefore, a child sitting inside it will also have a circular motion. (iv) Oscillatory motion The child on a see-saw goes up and down continuously. It oscillates up-down. Therefore, it is an oscillatory motion. (v) Oscillatory motion The hammer hits the electric bell and vibrates rapidly. Therefore, it is an oscillatory motion. (vi) Straight line The train is moving on a straight bridge. Therefore, it has a motion along a straight line.Question 2: Which of the following are not correct?
(i) The basic unit of time is second.
(ii) Every object moves with a constant speed.
(iii) Distances between two cities are measured in kilometres.
(iv) The time period of a given pendulum is not constant.
(v) The speed of a train is expressed in m/h.
Answer:
(i) Correct Second is the SI unit of time. (ii) Not correct An object can move with constant or variable speed. (iii) Correct The distance between two cities can be very large. Since kilometre is a bigger unit of distance, the distance between two cities is measured in kilometres. (iv) Not correct Time period of a pendulum depends on the length of the thread. Hence, it is constant for a particular pendulum. (v) Not correct The speed of a train is measured either in km/h or in m/sQuestion 3: A simple pendulum takes 32 s to complete 20 oscillations. What is the time period of the pendulum?
Answer: Number of oscillations = 20
Total time taken to complete 20 oscillations = 32 sQuestion 4: The distance between two stations is 240 km. A train takes 4 hours to cover this distance. Calculate the speed of the train.
Answer: Distance between the two stations = 240 km
Time taken = 4 hQuestion 5: The odometer of a car reads 57321.0 km when the clock shows the time 08:30 AM. What is the distance moved by the car, if at 08:50 AM, the odometer reading has changed to 57336.0 km? Calculate the speed of the car in km/min during this time. Express the speed in km/h also.
Answer: Initial reading of the odometer of the car = 57321.0 km
Final reading of the odometer of the car = 57336.0 km Distance covered by the car = Final reading of the odometer of the car − Initial reading of the odometer of the car = 57336.0 − 57321.0 = 15 km The given car starts at 8:30 a.m. and stops at 8:50 a.m. Therefore, time taken by the car to cover the distance is (8:50 − 8:30) min = 20 min Distance covered by the car = 15 km Time taken by the car = 20 min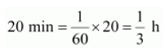 Time taken by the car = 1/3 h
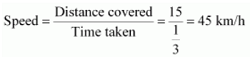
Question 6: Salma takes 15 minutes from her house to reach her school on a bicycle. If the bicycle has a speed of 2 m/s, calculate the distance between her house and the school.
Answer:
Time taken by Salma to reach her school from her home = 15 min = 15 × 60 = 900 s Speed of her bicycle = 2 m/sQuestion 7: Show the shape of the distance-time graph for the motion in the following cases:
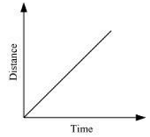
(i) A car moving with a constant speed.
(ii) A car parked on a side road.
Answer: (i) A car moving with a constant speed covers equal distance in equal intervals of time. Such motion of car is represented in the given distance-time graph.
 (ii) The distance-time graph of a car parked on a road side is such that with the increase in time, there is no change in distance, as shown in the given figure.
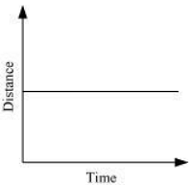
Question 8: Which of the following relations is correct?
(i) Speed = Distance × Time
(ii) ![]()
(iii) 
(iv) ![]()
(ii) Speed of an object is given by the relation
Question 9: The basic unit of speed is:
(i) km/min
(ii) m/min
(iii) km/h
(iv) m/s
Answer : (iv) m/s
The basic unit of distance is metre (m). The basic unit of time is second (s).Question 10: A car moves with a speed of 40 km/h for 15 minutes and then with a speed of 60 km/h for the next 15 minutes. The total distance covered by the car is:
(i) 100 km
(ii) 25 km
(iii) 15 km
(iv) 10 km
Answer: (ii) 25 km
Case I
Speed of the car = 40 km/h Time taken = 15 min = 15/60 = 0.25 hCase II
Speed of the car = 60 km/h Time taken = 15 min = 15/60 = 0.25 hQuestion 11: Suppose the two photographs, shown in Figure 1 and Figure 2, had been taken at an interval of 10 seconds. If a distance of 100 metres is shown by 1 cm in these photographs, calculate the speed of the blue car.
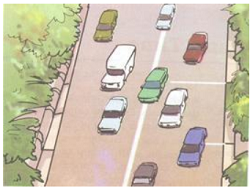
Figure 1 Vehicles moving in the same direction of on a road

Figure 2 Position of vehicles shown in Figure 1 after some time
Answer: The distance covered by the blue car (as evident from the photograph) from one white strip to another, which is measured by scale is 1.4 cm.
It is given that 1 cm is equivalent to 100 m. Therefore, 1.4 cm is equivalent to 140 m. Distance travelled by the car = 140 m Time interval between the two photographs = 10 sFigure 2 Position of vehicles shown in Figure 1 after some time
Answer: The distance covered by the blue car (as evident from the photograph) from one white strip to another, which is measured by scale is 1.4 cm.
It is given that 1 cm is equivalent to 100 m. Therefore, 1.4 cm is equivalent to 140 m. Distance travelled by the car = 140 m Time interval between the two photographs = 10 s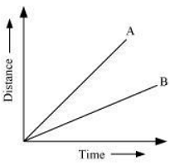
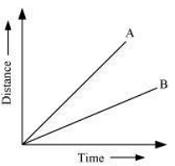
Distance-time graph for the motion of two cars
Answer: Vehicle A is moving faster than vehicle B.
 Speed is given by the relation
 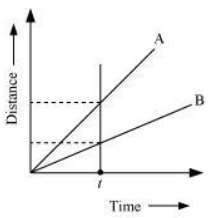 From the graph, it is evident that for a given time t, the distance covered by vehicle A is more than vehicle B. Hence, vehicle A is moving faster than vehicle B.
Question 13: Which of the following distance-time graphs shows a truck moving with speed which is not constant?
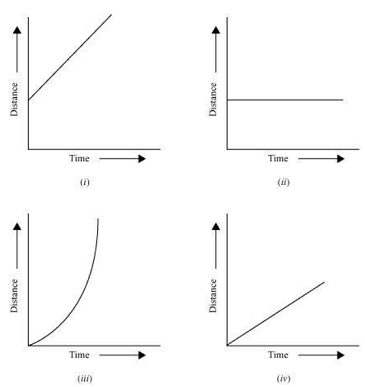
Answer: Graph ( iii ) In a distance-time graph, the constant speed of a truck will be represented by a straight line. In a distance-time graph, a straight line parallel to the time axis indicates that the truck is not moving. A curved line on the distance-time graph indicates that the truck is moving with a speed which is not constant.
Extend Learning — Activities and Projects
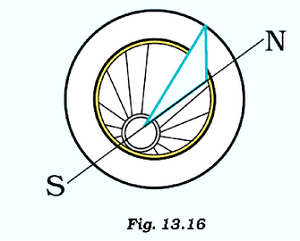
Question 1:You can make your own sundial and use it to mark the time of the day at your place. First of all find the latitude of your city with the help of an atlas. Cut out a triangular piece of a cardboard such that its one angle is equal to the latitude of your place and the angle opposite to it is a right angle. Fix this piece, called gnomon, vertically along a diameter of a circular board a shown in Fig. 13.16. One way to fix the gnomon could be to make a groove along a diameter on the circular board.
Next, select an open space, which receives sunlight for most of the day. Mark a line on the ground along the North-South direction. Place the sundial in the sun as shown in Fig. 13.16. Mark the position of the tip of the shadow of the gnomon on the circular board as early in the day as possible, say 8:00 AM. Mark the position of the tip of the shadow every hour throughout the day. Draw lines to connect each point marked by you with the centre of the base of the gnomon as shown in Fig. 13.16. Extend the lines on the circular board up to its periphery. You can use this sundial to read the time of the day at your place. Remember that the gnomon should always be placed in the North-South direction as shown in Fig. 13.16.
Answer:
The activity can be performed as follows:
- Find the latitude of the city with the help of Atlas.
- Cut out a triangular piece of a cardboard such that its one angle is equal to the latitude of the location and the angle opposite to it is a right angle.
- Fix this piece, called gnomon, vertically along a diameter of a circular board by making a groove along a diameter on the circular board.
- Choose a space, which receives sunlight for most of the day. Mark a line on the ground along the North-South direction. Place the sundial in the sun
- Mark the position of the tip of the shadow of the gnomon on the circular board as early in the day as possible. Mark the position of the tip of the shadow every hour throughout the day. Draw lines to connect each point marked by you with the centre of the base of the gnomon.
- Extend the lines on the circular board up to its periphery.
- This Sundial can be used for reading the time at chosen place.
Question 2: Collect information about time measuring devices that were used in the ancient times in different parts of the world. Prepare a brief write up on each one of them. The write up may include the name of the device, the place of its origin, the period when it was used, the unit in which the time was measured by it and a drawing or a photograph of the device, if available.
Answer:
The time measuring devices that were used in the ancient times in different parts of the world are:
1.Sun Dial
2.Water clocks
3.Sand clocks.
Sun Dial: This time measuring device uses a spot of light or shadow by the sun’s position on a reference scale. The prototypes of Sundials are seems to be originated in Russia and they were used in 1830s.
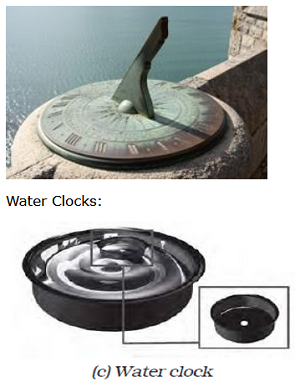 This time measuring device uses regulated water flow of liquid i.e. inflow or outflow of liquid to calculate the time. They are supposed to be existed in 16th Century in Egypt. Sand Clocks: The sand clocks are supposed to be invented at Alexandria about 150 B.C.
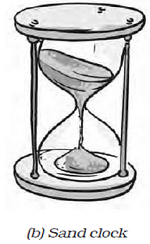
Question 3:Make a model of a sand clock which can measure a time interval of 2 minutes (Fig. 13.17).
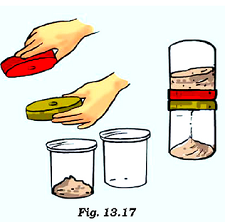
Answer:
1. Take one plastic cup and place it in upside down on a table. Put the other cup on the top of the first one so that the bottom parts of both cups touch each other.
2. Place two lids on the cups and make holes into them. And then invert one cup one another.
3. Measure the sand and put on top of one cup timer. Allow the sand to pass through the holes.
4. Place the cup timer on top of plate and note down the time taken by the sand to pass through the bottom of the timer.
5. Adjust the amount of sand until the time taken by it is 2 minutes for all the sand to pass through the bottom of the timer.
Question 4:You can perform an interesting activity when you visit a park to ride a swing. You will require a watch. Make the swing oscillate without anyone sitting on it. Find its time period in the same way as you did for the pendulum. Make sure that there are no jerks in the motion of the swing. Ask one of your friends to sit on the swing. Push it once and let it swing naturally. Again, measure its time period. Repeat the activity with different persons sitting on the swing. Compare the time period of the swing measured in different cases. What conclusions do you draw from this activity?
Answer:
- Oscillate the swing without any person sitting on it and note down the time period for 5 oscillations.
- Ask a person to sit on the swing and note down the time for 5 oscillations.
- Repeat the same for different persons.
- Calculate the average time taken by dividing to no. of oscillations.
The time period of the swing will be different for different cases. The time period of swing when no one is sitting on it will be least and will depend on the weight of the object sitting on the swing. The higher is the mass of the object on swing, the more will be the time taken by the swing to complete one oscillation because speed becomes less.
NCERT Solutions for Class 7 Science Chapter 13 FAQs
What are the 4 basic types of motion?
What causes motion?
What are the 10 examples of motion?
What are 2 characteristics of motion?
What is random motion?