
RS Aggarwal Solutions for Class 8 Maths Chapter 25 Exercise 25.1 Graphs

RS Aggarwal Solutions for Class 8 Maths Chapter 25 Exercise 25.1: Exercise 25.1 of Chapter 25 in RS Aggarwal's Class 8 Maths book, titled "Graphs," is designed to introduce students to the basics of plotting points on a Cartesian plane. This exercise focuses on helping students understand the concept of coordinates, the x-axis, and y-axis, and how to plot points based on given ordered pairs accurately.
Students are tasked with plotting multiple points and, in some cases, connecting these points to visualize the relationships between them. The exercise serves as a foundational step in understanding more complex graphing techniques, such as drawing and interpreting line graphs and other types of graphical representations.RS Aggarwal Solutions for Class 8 Maths Chapter 25 Exercise 25.1 Graphs Overview
Exercise 25.1 of Chapter 25 in RS Aggarwal's Class 8 Maths book, titled "Graphs," introduces students to the foundational concepts of graphing on the Cartesian plane. This exercise is crucial for building an understanding of how to visually represent mathematical relationships and data. It begins with the basics of the Cartesian coordinate system, where students learn about the x-axis, y-axis, and the origin. The focus is on understanding how to plot points using ordered pairs (coordinates) provided in the exercise. In this exercise, students are given a series of ordered pairs, and their task is to plot these points accurately on a graph. This requires understanding the position of each point based on its x and y coordinates. The exercise also includes questions where students must connect plotted points to form lines, which serves as a precursor to more complex graphing techniques like line graphs.What are the different types of Graphical Representation of Data?
Numerical data can be analysed via graphical representation. It displays in a diagram the relationship between concepts, ideas, information, and data. It is a highly effective learning strategy that is simple to comprehend. It is always contingent upon the nature of the data within a given domain. Data organization and comprehension are greatly aided by the use of graphic presentation techniques. Several graphical techniques exist, some of which are listed below:- The bar graph is a suitable approach to use when comparing different categories.
- A pie chart is the best way to compare portions of a whole.
- A histogram can be used to make data that is presented in intervals easier to grasp.
- If the data is consistently changing over time, a line graph will be helpful.
RS Aggarwal Solutions for Class 8 Maths Chapter 25 Exercise 25.1 PDF
The exercise is designed to strengthen students' spatial reasoning and their ability to interpret and visualize mathematical information graphically. It also introduces them to the concept of graphing as a tool for analyzing and solving real-world problems. Here we have provided RS Aggarwal Solutions for Class 8 Maths Chapter 25 Exercise 25.1 Graphs pdf -RS Aggarwal Solutions for Class 8 Maths Chapter 25 Exercise 25.1 PDF
RS Aggarwal Solutions for Class 8 Maths Chapter 25 Exercise 25.1 (Ex 25A)
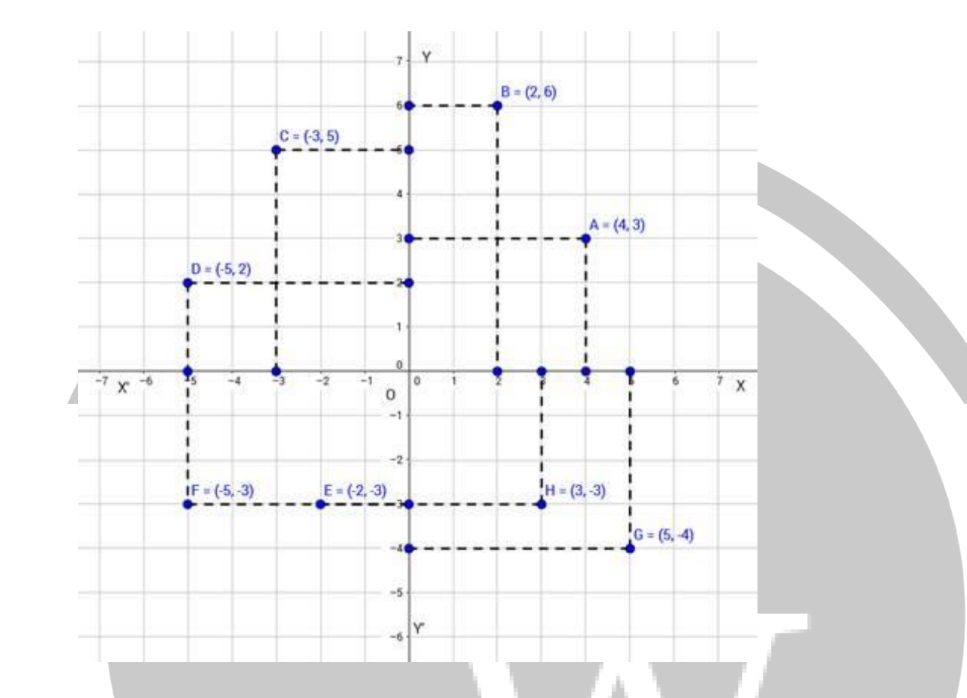
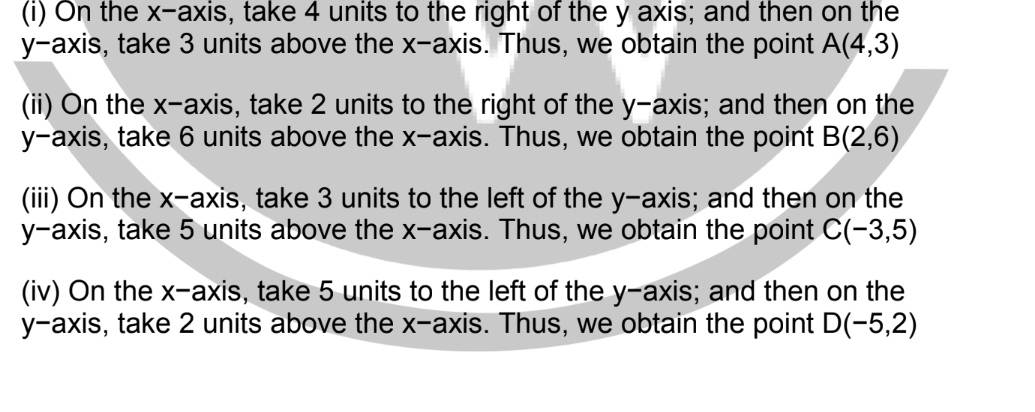
Question 1:
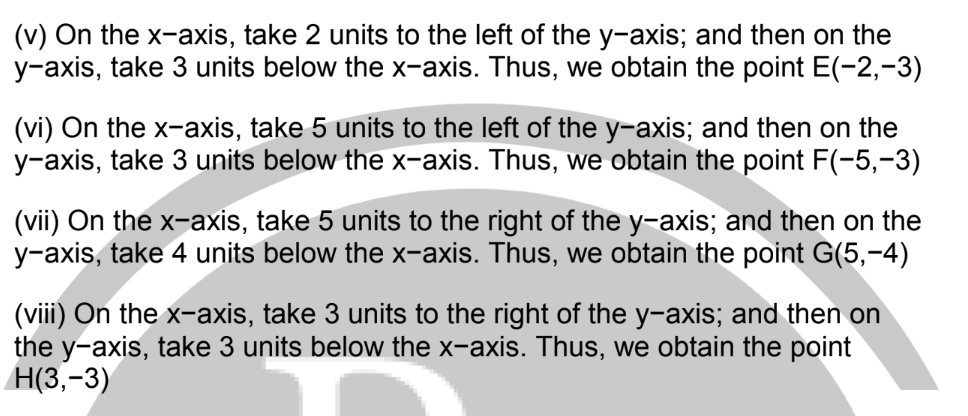
Plot the given x and y axis as given below -

Benefits of RS Aggarwal Solutions for Class 8 Maths Chapter 25 Exercise 25.1
The RS Aggarwal Solutions for Class 8 Maths Chapter 25 Exercise 25.1 on Graphs offer several key benefits to students:Concept Clarity : The solutions provide clear, step-by-step explanations, helping students understand the fundamental concepts of plotting points on a Cartesian plane, which is essential for mastering graphing techniques.
Accuracy in Plotting : By following the detailed solutions, students learn to plot points with precision, ensuring that they can accurately represent data on a graph.
Confidence Building : The solutions guide students through each problem methodically, boosting their confidence as they successfully complete the exercise and understand the concepts involved.
Preparation for Complex Graphs : Exercise 25.1 lays the groundwork for more advanced graphing exercises. The solutions help students build a strong foundation, making it easier for them to tackle more complex problems in subsequent exercises.
Self-Assessment : Students can use the solutions to check their work and identify any mistakes, allowing them to learn from errors and improve their graphing skills.
Enhanced Problem-Solving Skills : The solutions encourage students to think critically about the relationship between coordinates and their graphical representation, thereby improving their problem-solving abilities.
Independence in Learning : With the step-by-step solutions, students can study and practice independently, fostering a sense of responsibility and self-reliance in their learning process.
RS Aggarwal Solutions for Class 8 Maths Chapter 25 Exercise 25.1 FAQs
What is the focus of Exercise 25.1 in RS Aggarwal Class 8 Maths Chapter 25?
How do RS Aggarwal Solutions help in solving Exercise 25.1 on Graphs?
What concepts are reinforced through RS Aggarwal Solutions for Exercise 25.1?
Can RS Aggarwal Solutions for Exercise 25.1 help in improving accuracy in graph plotting?