Stress – Strain Graphs
Share
Stress – Strain Graphs
Solids And Fluids of Class 11
Stress – Strain Graphs
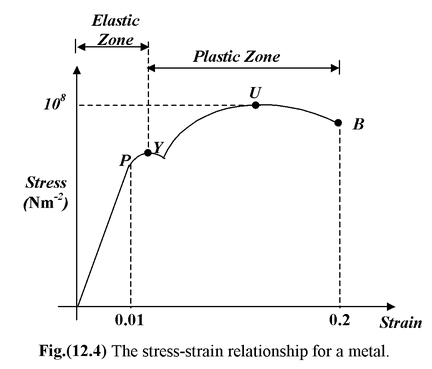
The stress-strain graph of a ductile metal is shown in figure(12.4). Initially, the stress-strain graph is linear and it obeys the Hooke’s Law upto the point P called the proportional limit. After the proportional limit the σ - ε graph is non-linear but it still remains elastic upto the yield point Y where the slope of the curve is zero. At the yield point the material starts deforming under constant stress – it behaves like a viscous liquid. The yield point is the beginning of the plastic zone. After the yield point the material starts gaining strength due to excessive deformation and this phenomenon is called strain hardening. The point U shows the ultimate strength of the material. It is the maximum stress that the material can sustain without failure. After the point U the curve goes down toward the breaking point B because the calculation of the stress is based on the original cross-sectional area whereas the cross-sectional areas of the sample actually decreases.