NCERT Solutions for Class 11 Maths chapter 15-Statistics Exercise 15.1
NCERT Solutions for Class-11 Maths Chapter-15 Statistics
NCERT Solutions for Class 11 Maths
Chapter-15 Statistics Exercise 15.1 prepared by the expert of Physics Wallah score more with Physics Wallah NCERT Class 11 maths solutions. You can download and share
NCERT Solutions
for Class 11 Maths.
NCERT Solutions for Class-11 Maths Exercise 15.1
Question
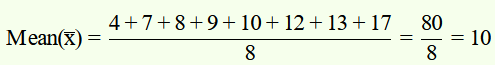
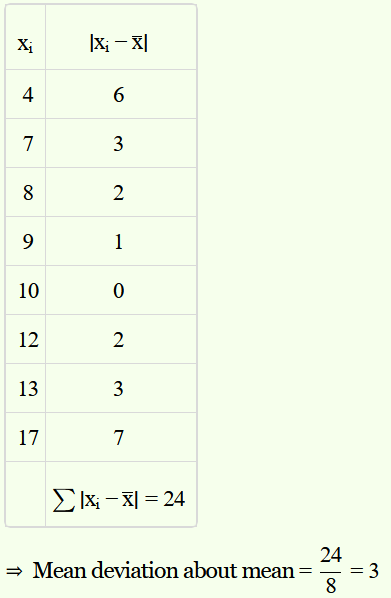
1. Find the mean deviation about the mean for the data
4, 7, 8, 9, 10, 12, 13, 17
Solution :
The given data is
4, 7, 8, 9, 10, 12, 13, 17
Question
2. Find the mean deviation about the mean for the data
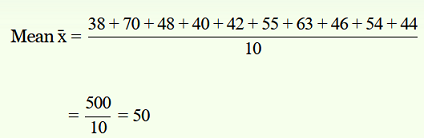
38, 70, 48, 40, 42, 55, 63, 46, 54, 44
Solution :
The given data is
38, 70, 48, 40, 42, 55, 63, 46, 54, 44
Mean of the given data,
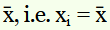
The deviations of the respective observations from the mean
 are
are
–12, 20, –2, –10, –8, 5, 13, –4, 4, –6
The absolute values of the deviations, i.e.
 , are
, are
12, 20, 2, 10, 8, 5, 13, 4, 4, 6
The required mean deviation about the mean is
Question
3. Find the mean deviation about the median for the data.
13, 17, 16, 14, 11, 13, 10, 16, 11, 18, 12, 17
Solution :
The given data is
13, 17, 16, 14, 11, 13, 10, 16, 11, 18, 12, 17
Here, the numbers of observations are 12, which is even.
Arranging the data in ascending order, we obtain
10, 11, 11, 12, 13, 13, 14, 16, 16, 17, 17, 18
The number of observations is 12
Then,
Median = ((12/2)
th
observation + ((12/2)+ 1)
th
observation)/2
(12/2)
th
observation = 6
th
= 13
(12/2)+ 1)
th
observation = 6 + 1
= 7
th
= 14
Median = (13 + 14)/2
= 27/2
= 13.5
So, the absolute values of the respective deviations from the median, i.e., |x
i
– M| are
3.5, 2.5, 2.5, 1.5, 0.5, 0.5, 0.5, 2.5, 2.5, 3.5, 3.5, 4.5

Mean Deviation,

= (1/12) × 28
= 2.33
Question
4. Find the mean deviation about the median for the data
36, 72, 46, 42, 60, 45, 53, 46, 51, 49
Solution :
First we have to arrange the given observations into ascending order,
36, 42, 45, 46, 46, 49, 51, 53, 60, 72.
The number of observations is 10
Then,
Median = ((10/2)
th
observation + ((10/2)+ 1)
th
observation)/2
(10/2)
th
observation = 5
th
= 46
(10/2)+ 1)
th
observation = 5 + 1
= 6
th
= 49
Median = (46 + 49)/2
= 95
= 47.5
So, the absolute values of the respective deviations from the median, i.e., |x
i
– M| are
11.5, 5.5, 2.5, 1.5, 1.5, 1.5, 3.5, 5.5, 12.5, 24.5

Mean Deviation,

= (1/10) × 70
= 7
So, the mean deviation about the median for the given data is 7.
Question
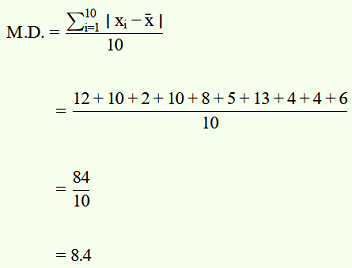
5. Find the mean deviation about the mean for the data.
|
x
i
|
5
|
10
|
15
|
20
|
25
|
|
f
i
|
7
|
4
|
6
|
3
|
5
|
Solution :
|
x
i
|
f
i
|
f
i
x
i
|

|

|
|
5
|
7
|
35
|
9
|
63
|
|
10
|
4
|
40
|
4
|
16
|
|
15
|
6
|
90
|
1
|
6
|
|
20
|
3
|
60
|
6
|
18
|
|
25
|
5
|
125
|
11
|
55
|
|
|
25
|
350
|
|
158
|
Question
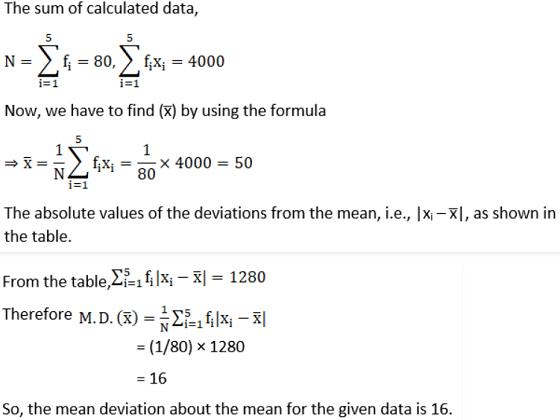
6. Find the mean deviation about the mean for the data
|
x
i
|
10
|
30
|
50
|
70
|
90
|
|
f
i
|
4
|
24
|
28
|
16
|
8
|
Solution :
|
x
i
|
f
i
|
f
i
x
i
|
|
|
|
10
|
4
|
40
|
40
|
160
|
|
30
|
24
|
720
|
20
|
480
|
|
50
|
28
|
1400
|
0
|
0
|
|
70
|
16
|
1120
|
20
|
320
|
|
90
|
8
|
720
|
40
|
320
|
|
|
80
|
4000
|
|
1280
|
Question
7. Find the mean deviation about the median for the data.
|
x
i
|
5
|
7
|
9
|
10
|
12
|
15
|
|
f
i
|
8
|
6
|
2
|
2
|
2
|
6
|
Solution :
The given observations are already in ascending order.
Adding a column corresponding to cumulative frequencies of the given data, we obtain the following table.
|
x
i
|
f
i
|
c.f.
|
|
5
|
8
|
8
|
|
7
|
6
|
14
|
|
9
|
2
|
16
|
|
10
|
2
|
18
|
|
12
|
2
|
20
|
|
15
|
6
|
26
|
|
|x
i
– M|
|
2
|
0
|
2
|
3
|
5
|
8
|
|
fi
|
8
|
6
|
2
|
2
|
2
|
6
|
|
f
i
|x
i
– M|
|
16
|
0
|
4
|
6
|
10
|
48
|
Now, N = 26, which is even.
Median is the mean of the 13
th
and 14
th
observations. Both of these observations lie in the cumulative frequency 14, for which the corresponding observation is 7.
Then,
Median = (13
th
observation + 14
th
observation)/2
= (7 + 7)/2
= 14/2
= 7
So, the absolute values of the respective deviations from the median, i.e., |x
i
– M| are shown in the table.
.
Question
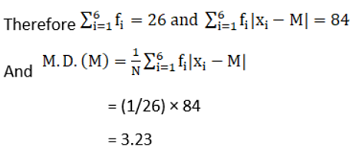
8. Find the mean deviation about the median for the data
|
xi
|
15
|
21
|
27
|
30
|
35
|
|
fi
|
3
|
5
|
6
|
7
|
8
|
Solution :
The given observations are already in ascending order.
Adding a column corresponding to cumulative frequencies of the given data, we obtain the following table.
|
x
i
|
f
i
|
c.f.
|
|
15
|
3
|
3
|
|
21
|
5
|
8
|
|
27
|
6
|
14
|
|
30
|
7
|
21
|
|
35
|
8
|
29
|
Here, N = 29, which is odd.
|
|x
i
– M|
|
15
|
9
|
3
|
0
|
5
|
|
f
i
|
3
|
5
|
6
|
7
|
8
|
|
f
i
|x
i
– M|
|
45
|
45
|
18
|
0
|
40
|
Now, N = 29, which is odd.
So 29/2 = 14.5
The cumulative frequency greater than 14.5 is 21, for which the corresponding observation is 30.
Then,
Median = (15
th
observation + 16
th
observation)/2
= (30 + 30)/2
= 60/2
= 30
So, the absolute values of the respective deviations from the median, i.e., |x
i
– M| are shown in the table.
Question
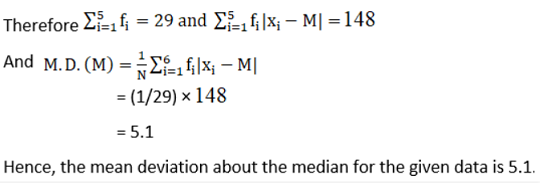
9. Find the mean deviation about the mean for the data.
|
Income per day
|
Number of persons
|
|
0-100
|
4
|
|
100-200
|
8
|
|
200-300
|
9
|
|
300-400
|
10
|
|
400-500
|
7
|
|
500-600
|
5
|
|
600-700
|
4
|
|
700-800
|
3
|
Solution :
The following table is formed.
|
Income per day
|
Number of persons fi
|
Mid-point x
i
|
f
i
x
i
|
|
|
|
0 – 100
|
4
|
50
|
200
|
308
|
1232
|
|
100 – 200
|
8
|
150
|
1200
|
208
|
1664
|
|
200 – 300
|
9
|
250
|
2250
|
108
|
972
|
|
300 – 400
|
10
|
350
|
3500
|
8
|
80
|
|
400 – 500
|
7
|
450
|
3150
|
92
|
644
|
|
500 – 600
|
5
|
550
|
2750
|
192
|
960
|
|
600 – 700
|
4
|
650
|
2600
|
292
|
1168
|
|
700 – 800
|
3
|
750
|
2250
|
392
|
1176
|
|
|
50
|
|
17900
|
|
7896
|
Here,
Question
10. Find the mean deviation about the mean for the data
|
Height in cms
|
Number of boys
|
|
95-105
|
9
|
|
105-115
|
13
|
|
115-125
|
26
|
|
125-135
|
30
|
|
135-145
|
12
|
|
145-155
|
10
|
Solution :
The following table is formed.
|
Height in cms
|
Number of boys f
i
|
Mid-point x
i
|
f
i
x
i
|
|
|
|
95-105
|
9
|
100
|
900
|
25.3
|
227.7
|
|
105-115
|
13
|
110
|
1430
|
15.3
|
198.9
|
|
115-125
|
26
|
120
|
3120
|
5.3
|
137.8
|
|
125-135
|
30
|
130
|
3900
|
4.7
|
141
|
|
135-145
|
12
|
140
|
1680
|
14.7
|
176.4
|
|
145-155
|
10
|
150
|
1500
|
24.7
|
247
|
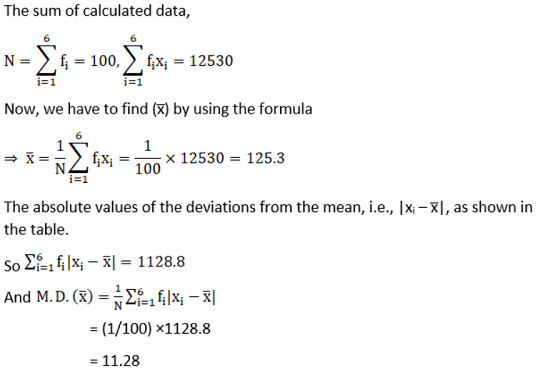
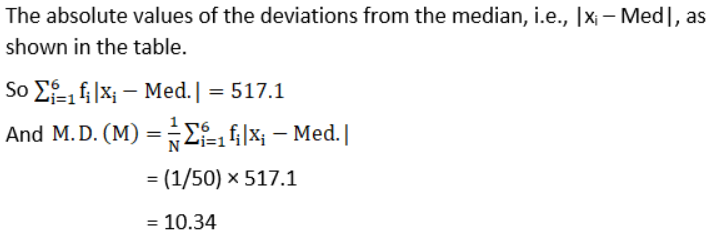
Question
11. Find the mean deviation about median for the following data:
|
Marks
|
Number of girls
|
|
0-10
|
6
|
|
10-20
|
8
|
|
20-30
|
14
|
|
30-40
|
16
|
|
40-50
|
4
|
|
50-60
|
2
|
Solution :
The following table is formed.
|
Marks
|
Number of girls f
i
|
Cumulative frequency (c.f.)
|
Mid-point x
i
|
|x
i
– Med.|
|
f
i
|x
i
– Med.|
|
|
0-10
|
6
|
6
|
5
|
22.85
|
137.1
|
|
10-20
|
8
|
14
|
15
|
12.85
|
102.8
|
|
20-30
|
14
|
28
|
25
|
2.85
|
39.9
|
|
30-40
|
16
|
44
|
35
|
7.15
|
114.4
|
|
40-50
|
4
|
48
|
45
|
17.15
|
68.6
|
|
50-60
|
2
|
50
|
55
|
27.15
|
54.3
|
|
|
50
|
|
|
|
517.1
|
The class interval containing N
th
/2 or 25
th
item is 20-30
So, 20-30 is the median class.
Then,
Median = l + (((N/2) – c)/f) × h
Where, l = 20, c = 14, f = 14, h = 10 and n = 50
Median = 20 + (((25 – 14))/14) × 10
= 20 + 7.85
= 27.85
Question
12. Calculate the mean deviation about median age for the age distribution of 100 persons given below:
|
Age
|
Number
|
|
16-20
|
5
|
|
21-25
|
6
|
|
26-30
|
12
|
|
31-35
|
14
|
|
36-40
|
26
|
|
41-45
|
12
|
|
46-50
|
16
|
|
51-55
|
9
|
Solution :
The given data is not continuous. Therefore, it has to be converted into continuous frequency distribution by subtracting 0.5 from the lower limit and adding 0.5 to the upper limit of each class interval.
The table is formed as follows.
|
Age
|
Number f
i
|
Cumulative frequency (c.f.)
|
Mid-point x
i
|
|x
i
– Med.|
|
fi |x
i
– Med.|
|
|
15.5-20.5
|
5
|
5
|
18
|
20
|
100
|
|
20.5-25.5
|
6
|
11
|
23
|
15
|
90
|
|
25.5-30.5
|
12
|
23
|
28
|
10
|
120
|
|
30.5-35.5
|
14
|
37
|
33
|
5
|
70
|
|
35.5-40.5
|
26
|
63
|
38
|
0
|
0
|
|
40.5-45.5
|
12
|
75
|
43
|
5
|
60
|
|
45.5-50.5
|
16
|
91
|
48
|
10
|
160
|
|
50.5-55.5
|
9
|
100
|
53
|
15
|
135
|
|
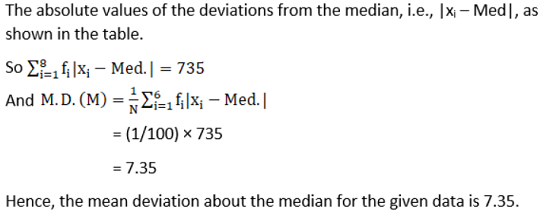
|
100
|
|
|
|
735
|
The class interval containing N
th
/2 or 50
th
item is 35.5 – 40.5
So, 35.5 – 40.5 is the median class.
Then,
Median = l + (((N/2) – c)/f) × h
Where, l = 35.5, c = 37, f = 26, h = 5 and N = 100
Median = 35.5 + (((50 – 37))/26) × 5
= 35.5 + 2.5
= 38