ICSE Worksheet for Chapter - 13 Graphs Class 8
Worksheets For class 8
Find ICSE Worksheet for chapter-13 Graphs class 8
- CLASS-8
- BOARD: ICSE
- Mathematic Worksheet - 13
- TOPIC: Graphs
- For other ICSE Worksheet for class 8 Mathematic check out main page of Physics Wallah.
SUMMARY
- The pie chart or a pie graph is a method of representing a given numerical data in the form of sectors of a circle.
-
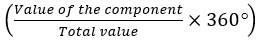
Central angle of the component =
SECTION – I(OBJECTIVE)
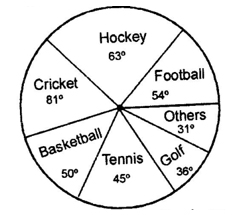
- Directions (Q.1 to 5): the circle graph given here shows the spending of a country on various sports during a particular year. Study the graph carefully and answer the questions given below it.
-
SECTION – II(SUBJECTIVE)
-
The number of students admitted in different faculties of a college are:
- Faculty Science Arts Commerce Law Education Total
- No. of students 1000 1200 650 450 300 3600
- Construct the pie chart for the following distribution.
-
Given pie chart represents the expenditure on different items in constructing a flat in a metro city. Find the percentage expenditure on different items reading the pie chart, if the cost of the flat is Rs 5, 40,000. Find the following:
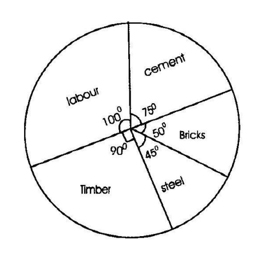
- i. The expenditure incurred on steel and cement separately.
- ii. Difference of expenditures incurred on timber and bricks.
Solutions: to worksheet-13 Topic- Graphs
Objective:
- A
- D
- C
- B
- A
- B
- D
Subjective:
- 2) Rs 112500; Rs 6000
Related Link
- Class 8 Physics Notes
- Class 8 Chemistry Notes
- Class 8 Biology Notes
- Class 8 Maths Notes
- Class 8 SST Notes
- Online Quiz Class 8 Physics
- Online Quiz Class 8 Chemistry
- Online Quiz Class 8 Biology
- Online Quiz Class 8 Maths
- Online test Class 8 SST
- MCQ Questions for class 8 Science
- Important Questions Class 8 Maths
- Sample Paper Class 8 Science
- Sample Papers Class 8 Maths
- NCERT solutions class 8
- RS Aggarwal Solutions Class-8
- Lakhmir Singh Solutions Class 8
- Ask your Doubt
- Science Formulas