
Cumulative Frequency Curve Or Ogive Graph
Share
Cumulative Frequency Curve Or Ogive Graph
Statistics of Class 10
Cumulative Frequency Curve Or Ogive Graph
In a cumulative frequency polygon or curves, the cumulative frequencies are plotted against the lower and upper limits of class intervals depending upon the manner in which the series has been cumulated. There are two methods of constructing a frequency polygon or an Ogive.
(i) Less than method (ii) More than method
In ungrouped frequency distribution:
question 1. The marks obtained by 400 students in medical entrance exam are given in the following table.
|
Marks Obtained |
400-450 |
450-500 |
500-550 |
550-600 |
600-650 |
650-700 |
700-750 |
750-80 |
|
No. of Examinees |
30 |
45 |
60 |
52 |
54 |
67 |
45 |
47 |
(i) Draw Ogive by less than method.
(ii) Draw Ogive by more than method.
(iii) Find the number of examinees, who have obtained the marks less than 625.
(iv) Find the number of examinees, who have obtained 625 and more than marks.
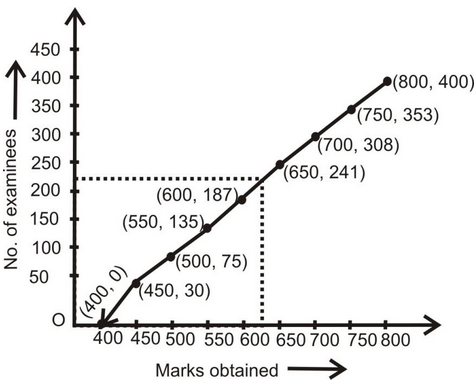
Solution: (i) Cumulative frequency table for less than Ogive method is as following.
|
Marks Obtained |
No. of Examinees |
|
Less than 450 |
30 |
|
Less than 500 |
75 |
|
Less than 550 |
135 |
|
Less than 600 |
187 |
|
Less than 650 |
241 |
|
Less than 700 |
308 |
|
Less than 750 |
353 |
|
Less than 800 |
400 |
Following are the Ogive for the above cumulative frequency table by applying the given method and the assumed scale.
(ii) Cumulative frequency table for more than Ogive method is as following : -
|
Marks Obtained |
No. of Examinees |
|
400 and more |
400 |
|
450 and more |
370 |
|
500 and more |
325 |
|
550 and more |
265 |
|
600 and more |
213 |
|
650 and more |
159 |
|
700 and more |
92 |
|
750 and more |
47 |
Following are the Ogive for the above cumulative frequency table.

(iii) So, the number of examinees, scoring marks less than 625 are approximately 220.
(iv) So, the number of examinees, scoring marks 625 and more will be approximately 190.
