
Mean For A Group Frequency Distribution
Statistics of Class 10
Mean For A Group Frequency Distribution
DIRECT METHOD:
Step 1: For each class, find the class mark xi as
xi = 1/2 (lower limit + upper limit)
Step 2: Calculate fixi for each i.
Step 3: Use the formula : 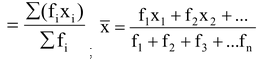 ;
;
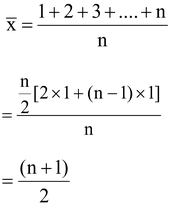
question 1. Find the arithmetic mean of 1, 2, 3, …., n.
Solution: The arithmetic mean of 1, 2, 3, ….., n is given by
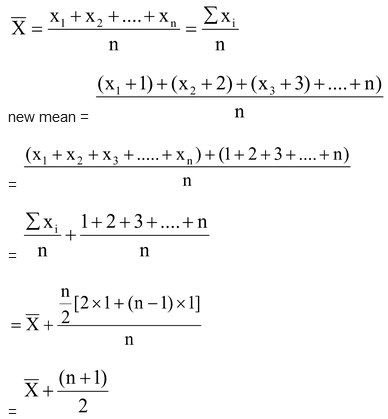
question 2. If the mean of n observations is .png) , then find the new mean when the first term is increased by 1, second term by 2, and so on.
, then find the new mean when the first term is increased by 1, second term by 2, and so on.
Solution:
ASSUMED MEAN METHOD:
Following steps are taken to solve cases by assumed-mean method.
Step 1: For each class interval, calculate the class mark xi by using the
formula: xi = 1/2 (lower limit + upper limit).
Step 2: Choose a value of xi in the middle as the assumed mean and denote it by A.
Step 3: Calculate the deviations di = (di - A) for each i.
Step 4: Calculate the( fidi) for each i.
Step 5: Find n = .png) .
.
Step 6: Calculate the mean, , by using the formula: 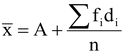 .
.
question 1. Using the assumed-mean method, find the mean of the following data:
|
Class |
0 – 10 |
10 – 20 |
20 – 30 |
30 – 40 |
40 – 50 |
|
Frequency |
7 |
8 |
12 |
13 |
10 |
Solution: Let A = 25 be the assumed mean. Then, we have:
|
Class interval |
Frequency fi |
Midvalue xi |
Deviation di = (xi – 25) |
(fi di) |
|
0 – 10 |
7 |
5 |
–20 |
–140 |
|
10 – 20 |
8 |
15 |
–10 |
–80 |
|
20 – 30 |
12 |
25 = A |
0 |
0 |
|
30 – 40 |
13 |
35 |
10 |
130 |
|
40 – 500 |
10 |
45 |
20 |
200 |
|
Σfi = 50 |
Σ(fi di)= 110 |
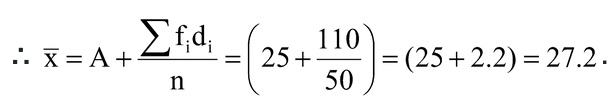 .
.
Hence, mean = 27.2.
STEP-DEVIATION METHOD:
Following steps are taken to solve cases by step-deviation method.
Step 1: For each class interval, calculate the class mark xi by using the formula:
xi = 1/2 (lower limit + upper limit).
Step 2: Choose a value of xi in the middle of the xi column as the assumed mean and denote it by A.
Step 3: Calculate h = [(upper limit) – (lower limit)].
Step 4: Calculate 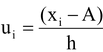 for each class.
Step 5: Calculate fiui for each class and find  .
.
Step 6: Calculate the mean, by using the formula: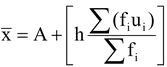 .
.
question 1. Calculate the mean of the following frequency distribution, using the step-deviation method:
|
Class interval |
Frequency |
|
0 – 50 |
17 |
|
50 – 100 |
35 |
|
100 – 150 |
43 |
|
150 – 200 |
40 |
|
200 – 250 |
21 |
|
250 – 300 |
24 |
Solution: Here, h = 50. Let the assumed mean be A = 125.
For calculating the mean, table is prepared as follows :
|
Class interval |
Frequency fi |
Midvalue xi |
|
(fi ui) |
|
0 – 50 |
17 |
25 |
–2 |
–34 |
|
50 – 100 |
35 |
75 |
–1 |
–35 |
|
100 – 150 |
43 |
125 = A |
0 |
0 |
|
150 – 200 |
40 |
175 |
1 |
40 |
|
200 – 250 |
21 |
225 |
2 |
42 |
|
250 – 300 |
24 |
275 |
3 |
72 |
|
Σfi = 180 |
Σ(fi ui)= (154–69) = 85 |
Thus, we have
A = 125, h = 50, = 180 and = 85.
Mean,
= 125 + [50 x 85/180]
= (125 + 23.61) = 148.61 .
Hence, the mean of the given frequency is 148.61.
MEAN FOR AN EXCLUSIVE SERIES:
question 1. Find the mean age (in years) from the following frequency distribution:
|
Age(in years) |
15–19 |
20–24 |
25–29 |
30–34 |
35–39 |
40–44 |
45–49 |
Total |
|
Frequency |
3 |
13 |
21 |
15 |
5 |
4 |
2 |
63 |
Solution: The given series is an Inclusive series. Making it an exclusive
|
Age (in years) |
Frequency fi |
Midvalue xi |
= (xi - 32)/5 |
(fi ui) |
|
14.5 – 19.5 |
3 |
17 |
–3 |
–9 |
|
19.5 – 24.5 |
13 |
22 |
–2 |
–26 |
|
24.5 – 29.5 |
21 |
27 |
–1 |
–21 |
|
29.5 – 34.5 |
15 |
32 = A |
0 |
0 |
|
34.5 – 39.5 |
5 |
37 |
1 |
5 |
|
39.5 – 44.5 |
4 |
42 |
2 |
8 |
|
44.5 – 49.5 |
2 |
47 |
3 |
6 |
|
Σfi = 63 |
Σ(fi ui)= (19–56) = –37 |
Thus, A = 32, h = 5, = 63 and = −37.
Mean,
= 32 + [5 x (-37/63) ] = (32 - 2.936) = (32 - 2.94) = 29.06.
Hence, mean age = 29.06 years.
