
Human Population Growth Curve
Human Population of Class 12
Human Population Growth Curve
Initially growth rate was low and remained in log phase for longtime. In 1600 A.D. population rise to 0.5 billion taking 1600 years to double.
After 1750 it doubled in 200 years, then doubled in next 130 years and then doubled in only 45 years (1930-1975) with current growth rate of 2% per annum.
Malthus (1798) stated “population if unchecked, increases in geometric ratio while the food resources increase in arithmetic ratio”. After a certain limit acute shortage of food occurs and due to starvation and malnutrition, individuals die.
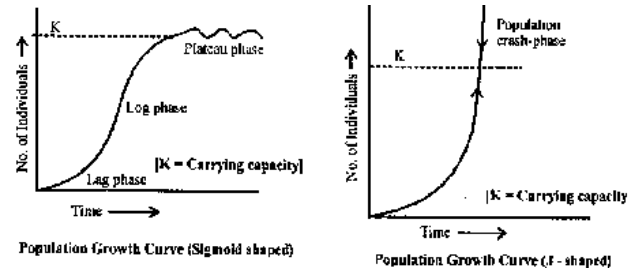
Fig. Population Growth Curve
Causes for growth of human population :
Advances in science and technology leading to increased production of food so, that it is adequate food for all has increased. Due to advancement in medical treatment average life expectancy, has also increased.
Decline in death rate and increase in longevity being the reason for increase in human population. Natural calamities like flood, storm, cyclones, tornadoes, earthquakes, etc., kill thousands of lives every year but with large birth rate the loss is compensated. For example, 50,000 people were killed in Bangladesh cyclone but for their 4.4% of birth rate, this number was replaced within 40 days.
Growth rate
P2 = P1 + B + I – D – E
Where – P2 = Present population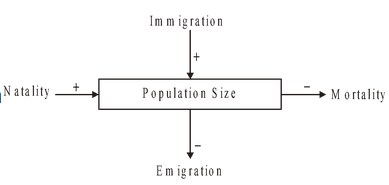
P1 = Previous population
B = Births
I = Immigration
D = Deaths
E = Emigration
Growth rate = 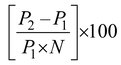
N = No. of years between two census
Rate of Change in Population Size
(a) In ‘S’ shaped growth curve, rate of change of population = 
(b) In ‘J’ shaped growth curve, rate of change of population = 
 or
or  = environmental resistance, r = Biotic potential , P= Population size
Doubling time of Population
Time taken by existing population to double itself Doubling time = 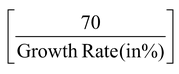 ‘70’ = demographic constant
With 2% growth rate Indian population would double in 70/2 =35 years.
Doubling time of world population = 35 – 40 years.
