Physics Wallah

Graphical Interpretation of Displacement, Velocity And Acceleration

Share

Share

Graphical Interpretation of Displacement, Velocity And Acceleration

Kinematics of Class 11
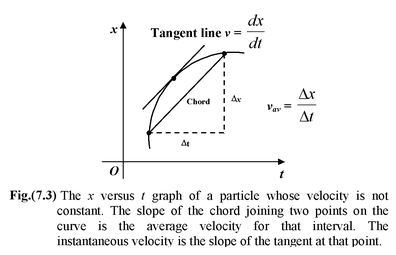
Average Velocity

The average velocity between two points in a given time interval can be obtained from a displacement versus time graph by computing the slope of the straight line joining the coordinates of the two points.

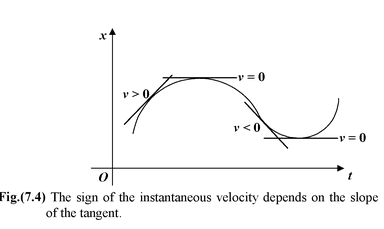
Instantaneous Velocity

The instantaneous velocity at time t is the slope of the tangent line drawn to the position−versus−time graph at that time.

Graphical Interpretation of Displacement, Velocity And Acceleration

Graphical Interpretation of Displacement, Velocity And Acceleration

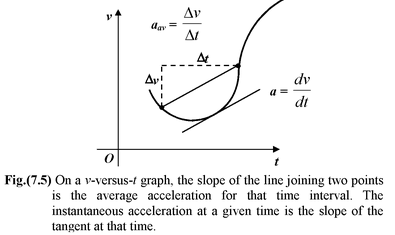
Average Acceleration

The average acceleration between two points in a time interval is equal to the slope of the chord connecting the points on a velocity versus time graph.

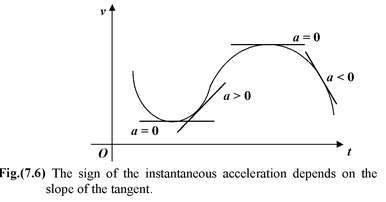
Instantaneous Acceleration

The instantaneous acceleration at time t is the slope of the tangent drawn to the velocity versus time graph.
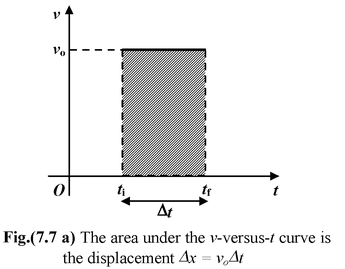
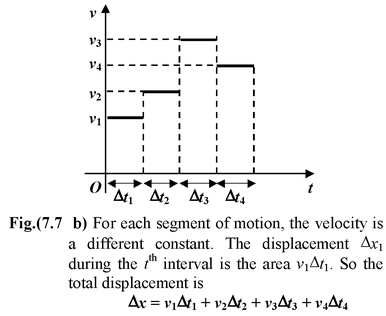
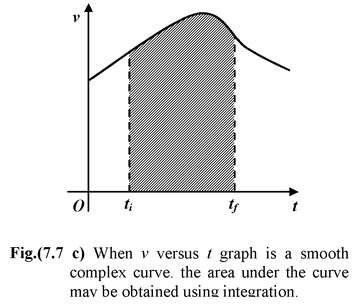
Graphical Interpretation of Displacement, Velocity And Acceleration

Graphical Interpretation of Displacement, Velocity And Acceleration

Displacement from Velocity Time Graphs

Given a velocity versus time graph, the displacement during an interval between time ti and tf is the area bounded by the velocity curve and the two vertical lines t = ti and t = tf, as shown in the Fig.(7.7 a).

Graphical Interpretation of Displacement, Velocity And Acceleration

Graphical Interpretation of Displacement, Velocity And Acceleration

Graphical Interpretation of Displacement, Velocity And Acceleration

Velocity from Acceleration Time Graphs

Given an acceleration−versus−time graph, the change in velocity between t = ti and t = tf is the area bounded by the acceleration curve and the vertical lines t = ti and t = tf.

Graphical Interpretation of Displacement, Velocity And Acceleration

Graphical Interpretation of Displacement, Velocity And Acceleration

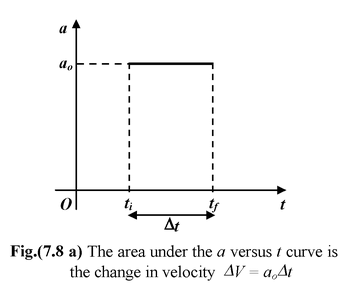
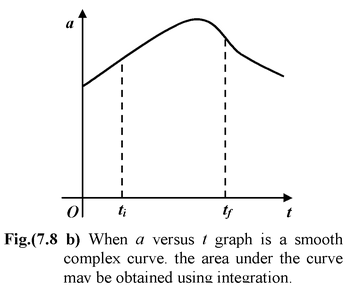
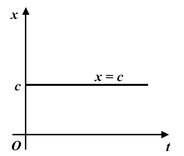
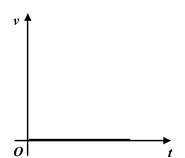
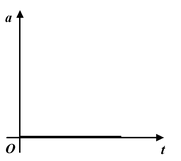
Table 7.1 Variation of Displacement (x), velocity (v) and acceleration (a) with respect to time for different types of motion.

Displacement

Velocity

Acceleration

1. At rest

Graphical Interpretation of Displacement, Velocity And Acceleration

Graphical Interpretation of Displacement, Velocity And Acceleration

Graphical Interpretation of Displacement, Velocity And Acceleration

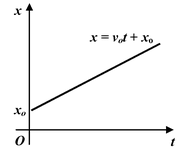
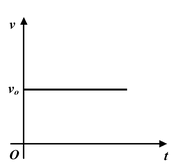
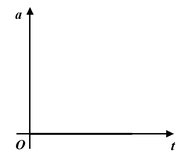
2. Motion with constant velocity

Graphical Interpretation of Displacement, Velocity And Acceleration

Graphical Interpretation of Displacement, Velocity And Acceleration

Graphical Interpretation of Displacement, Velocity And Acceleration

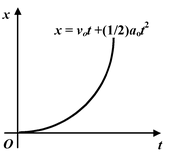
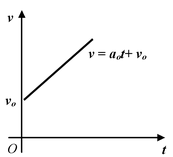
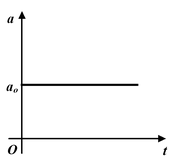
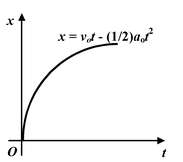
3. Motion with constant acceleration

Graphical Interpretation of Displacement, Velocity And Acceleration

Graphical Interpretation of Displacement, Velocity And Acceleration

Graphical Interpretation of Displacement, Velocity And Acceleration

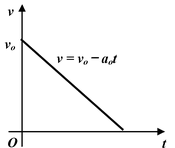
4. Motion with constant deceleration.
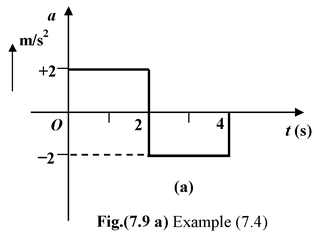
Graphical Interpretation of Displacement, Velocity And Acceleration

Graphical Interpretation of Displacement, Velocity And Acceleration

Graphical Interpretation of Displacement, Velocity And Acceleration

Example: 7.4

At t = 0 a particle is at rest at the origin. Its acceleration is 2 m/s2 for the first 2 second and −2 m/s2 for the next 2 s. Plot the
x versus t and v versus t graphs.

Solution

It is given that x = 0 and v = 0 at t = 0. The acceleration versus time graph is plotted in Fig. (7.9a). The velocity at t = 2 s is equal to the sum of velocity at t = 0 and the area under the acceleration−time graph between
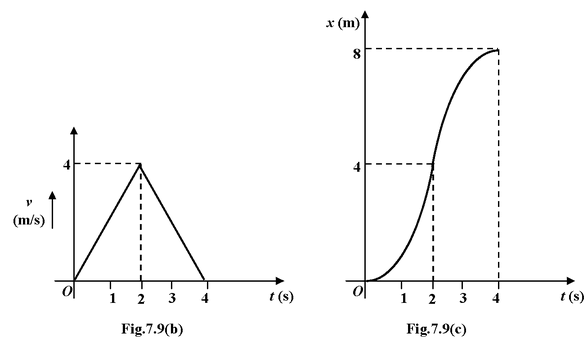
t = 0 and t = 2 s.

Graphical Interpretation of Displacement, Velocity And Acceleration

Graphical Interpretation of Displacement, Velocity And Acceleration

v2 = v0 + Graphical Interpretation of Displacement, Velocity And Acceleration

Since at t = 0: velocity is zero, vo = 0

∴ v2 = 0 + (2) (2) = 4 m/s

Similarly velocity at t = 4s is

v4 = v0 + Graphical Interpretation of Displacement, Velocity And Acceleration 
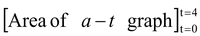
= 0 +2 (+2) + 2 (−2) = 0

Note that area below the x−axis is taken as negative

The displacement at t = 2 s is

x2 = x0 + Graphical Interpretation of Displacement, Velocity And Acceleration

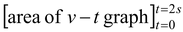
∴ x2 = 0 + 1/2 (2) (4) = 4 m

and x4 = 0 + 1/2 (4) (4) = 8 m

Popup Close ImagePopup Open Image
Talk to a counsellorHave doubts? Our support team will be happy to assist you!
Popup Image
Free Learning Resources
Know about Physics Wallah
Physics Wallah is an Indian edtech platform that provides accessible & comprehensive learning experiences to students from Class 6th to postgraduate level. We also provide extensive NCERT solutions, sample paper, NEET, JEE Mains, BITSAT previous year papers & more such resources to students. Physics Wallah also caters to over 3.5 million registered students and over 78 lakh+ Youtube subscribers with 4.8 rating on its app.
We Stand Out because
We provide students with intensive courses with India’s qualified & experienced faculties & mentors. PW strives to make the learning experience comprehensive and accessible for students of all sections of society. We believe in empowering every single student who couldn't dream of a good career in engineering and medical field earlier.
Our Key Focus Areas
Physics Wallah's main focus is to make the learning experience as economical as possible for all students. With our affordable courses like Lakshya, Udaan and Arjuna and many others, we have been able to provide a platform for lakhs of aspirants. From providing Chemistry, Maths, Physics formula to giving e-books of eminent authors like RD Sharma, RS Aggarwal and Lakhmir Singh, PW focuses on every single student's need for preparation.
What Makes Us Different
Physics Wallah strives to develop a comprehensive pedagogical structure for students, where they get a state-of-the-art learning experience with study material and resources. Apart from catering students preparing for JEE Mains and NEET, PW also provides study material for each state board like Uttar Pradesh, Bihar, and others

Copyright © 2026 Physicswallah Limited All rights reserved.